Whether you have skipped all of the previous sections, or you have studied everything within this spread trading guide, it is now time to pay very close attention.
Let me begin.
Firstly, I am going to assume that you have opened an account with one of the financial spread firms. If you have not, it does not matter; you’ll just have to play catch up.
I use Capital Spreads, though any other live financial spread account will do. To have all of the information that I need to trade in front of me, I log into my account through the client area and then click on the online trading tab. This takes me through to the live prices.
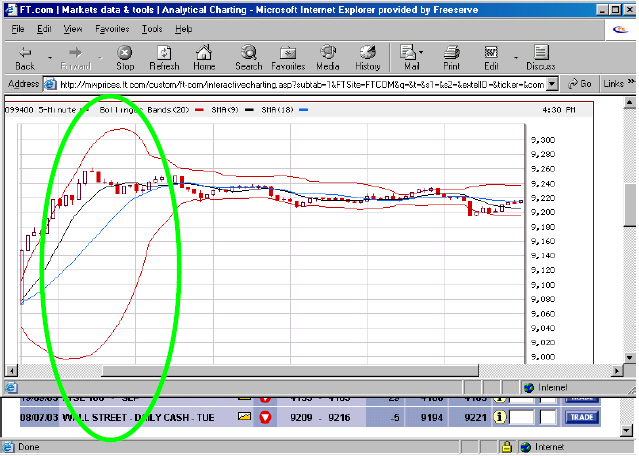
Now, the candlesticks show exactly what the market is doing while all of the indicators on the charts will verify that sentiment. For instance, if you look at the below chart, all of the indicators show strong sentiment for the market to rise (a buy phase) from the moment that the markets open.

The candlesticks show buying, the Bollinger bands are wide apart which indicates volatility and the moving averages are getting further apart which indicates the same.
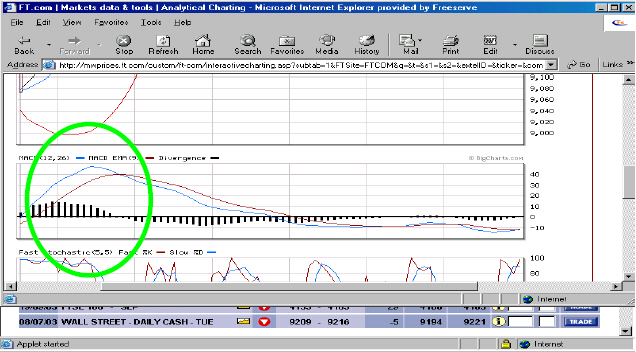
If you were to scroll down the screen to the Macd chart, it also shows the moving averages moving apart and rising.

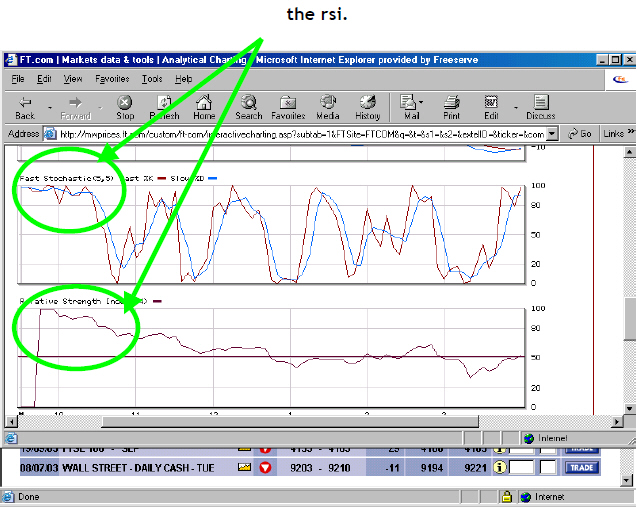
The fast stochastic is at the top of the scale and holding above 80, as is the RSI.

Within an hour of the markets opening, Bollinger bands and moving averages start to come together and change direction and the stochastic and rsi drop below 80. All sure signs that the market is changing direction and that it is time to get out and see where the market is about to go.
The market has moved 160 points and hopefully you have managed to get at least some of that move.
There is no need to remember all of the candlestick patterns, just be aware of the major candles like ‘Doji’, ‘Spinning top’, ‘Tweezer top’, ‘Tweezer bottom’, ‘Morning star’, ‘Evening star’, ‘Hammer’, ‘Hangman’ and ‘Engulfing’ candles.
These show change in market sentiment and along with the indicators give an excellent idea of market volatility and direction and whether or not the market is currently over bought (becoming expensive and therefore due to drop) or over sold (becoming very cheap and therefore due to rise).
I know you are going to be disappointed, but that is basically all that there is to trading.